Is there a day of the week when you prefer to code? Do you believe that certain programming languages harbour more positive communities? These are some of the questions that can be answered by the research methods we’ll be looking at today.
By using sentiment analysis on a commit comment we can judge its emotional content. If we perform this on a large number of commits, we can analyse whole repositories and projects by looking for patterns. Researchers at the Technical University of Munich found that Java projects tended to have more negative commit comments, distributed teams tended to have more positive commit comments, and that commit comments on Mondays were more negative than any other day of the week.[1]
For my first Hackday at Tails.com, I built on the research of Emitza Guzman, David Azócar, and Yang Li, and analysed the main private repository that we use. It has 31,724 commits, 43 contributors, and takes up ~1GB on disk. I was interested in finding out what days of the week were our most positive and most negative, whether the files we changed affected the emotion of the commit comment, and who were our most positive commit authors!
Sentimental What?
Sentimental analysis (sometimes called opinion mining) means extracting information from text. It’s used as part of recommendation systems, working out the voice of the customer, and calculating political sentiment on Twitter. In this project, it means understanding whether a commit comment is negative, neutral, or positive – we call this polarity.
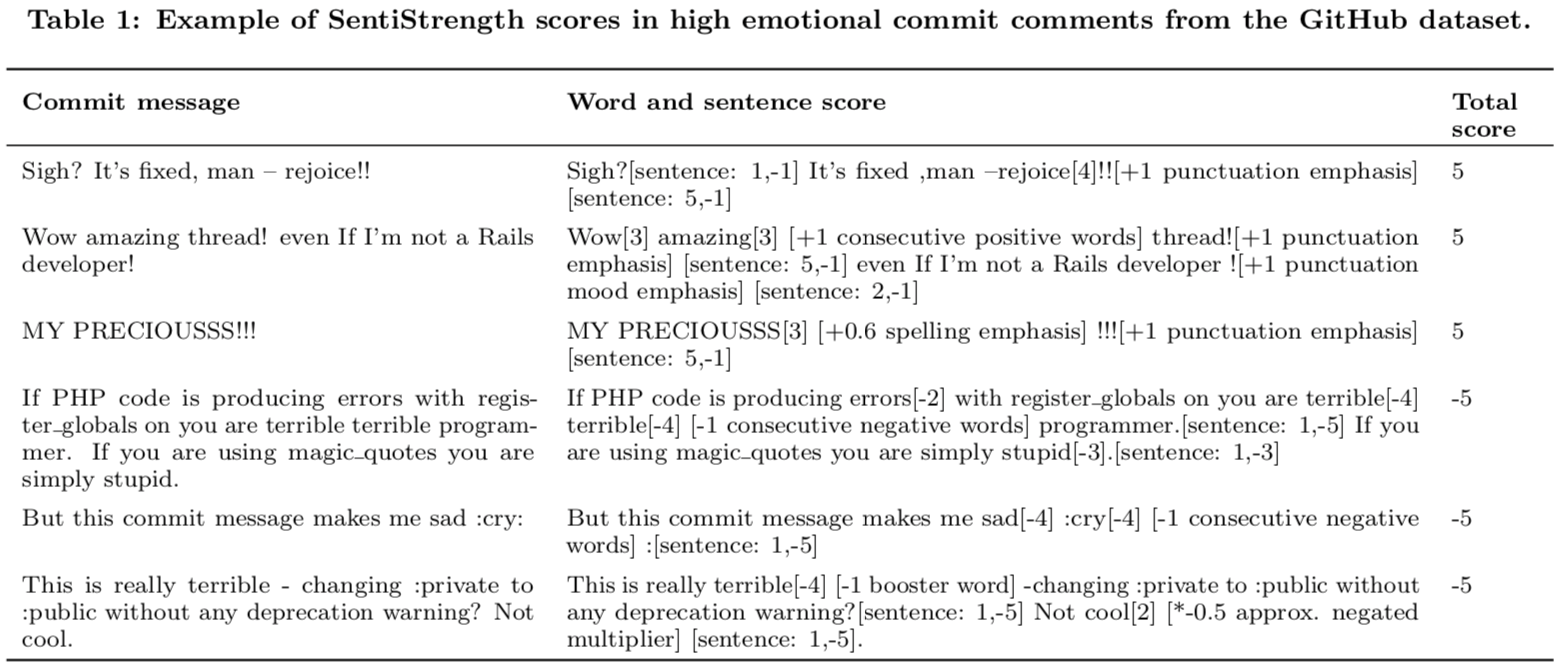
In Sentiment Analysis of Commit Comments in GitHub: An Empirical Study, Guzman et al., gave examples of their commit comment scoring. They used a tool called SentiStrength which calculates negative emotion and positive emotion separately. Guzman et al. averaged these two scores to get a number which fell within the range of negative [-5], neutral [0], and positive [5]. We can see how the tool breaks up sentences into meaningful chunks (tokenization) and scores them.[1]
Hacking
I didn’t want to have to crawl our repository every time I built my graphs so I needed to serialize the required information and save it to disk. The output of git log --pretty=raw --numstat gives us all the content we need to start extracting sentiment. It can be tricky to parse so the library git2json was used to pipe this output into a JSON format.
import os
import json
from git2json import git2jsons, run_git_log

# get all repos
repos = []
for root, dirs, files in os.walk('./repos'):
    repos = dirs
    break

# write the logs for each repo to a json file
for r in repos:
    path = './data/{}.json'.format(r)
    with open(path.format(r), 'w') as f:
        print('Writing to {}'.format(path))
        log = git2jsons(run_git_log(os.path.join(os.getcwd(), 'repos', r, '.git')))
        f.write(log)
        print('Done!')
TextBlob was used to calculate the sentiment of a commit comment. This library builds on the work of NLTK and pattern. It has a well documented API and I will definitely use it again in other classification projects. It uses a float within the range [-1, 1] to classify polarity.
>>> testimonial = TextBlob("Textblob is amazingly simple to use. What great fun!")
>>> testimonial.sentiment
Sentiment(polarity=0.39166666666666666, subjectivity=0.4357142857142857)
>>> testimonial.sentiment.polarity
0.39166666666666666
Here are some of the commit comments from our repository and how they scored.
Positive: (1.0, 'leave comment for valerio :D')
Positive: (1.0, 'add clippy js for awesome messaging')
Negative: (-1.0, 'Alembic branches are a cruel, cruel thing’)
Negative: (-0.9375, 'disable paypal :( for now!')
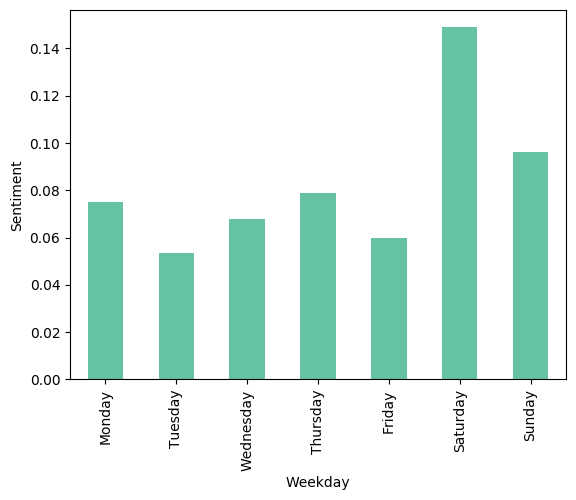
I used a data analysis library called pandas to group the sentiment data together and draw my graphs. In the following excerpt, it has been imported as pd. Here, I draw a bar chart to compare the sentiment of commit comments written on different days of the week.
def week_day_sentiment(log, name='git'):
    sentiments = {}
    for commit in log:
        # timestamp -> day of week
        day = datetime.fromtimestamp(commit['author']['date']).strftime('%A')
        if day not in sentiments:
            sentiments[day] = []
        sentiment = TextBlob(commit['message']).sentiment.polarity
        sentiments[day].append(sentiment)

    df = pd.DataFrame({day: pd.Series(s)
                       for day, s in sentiments.items()})
    # order mon -> sun
    df = df.reindex(sorted(df.columns, key=lambda day: WEEK_DAYS[day]), axis=1)
    bar = df.mean().plot.bar(colormap='Set2')
    bar.set_ylabel('Sentiment')
    bar.set_xlabel('Weekday')
    bar.figure.savefig('{}_week_day_sentiment.png'.format(name), bbox_inches='tight')
I told an engineer that I suspected that the previous research would hold true for our repository and that Mondays would have more negative commit comments. The engineer countered with their personal opinion: they came in on Monday excited to solve problems and experienced a small dip on Tuesday before picking up for the rest of the week. They also suggested that Saturdays would have more positive commit comments as voluntarily working on the codebase would come from a place of joy.
They were right! I found that commit comments written on a Tuesday are more negative and that there is a positive spike on Saturdays.
Negative: (-1.0, 'Alembic branches are a cruel, cruel thing’)
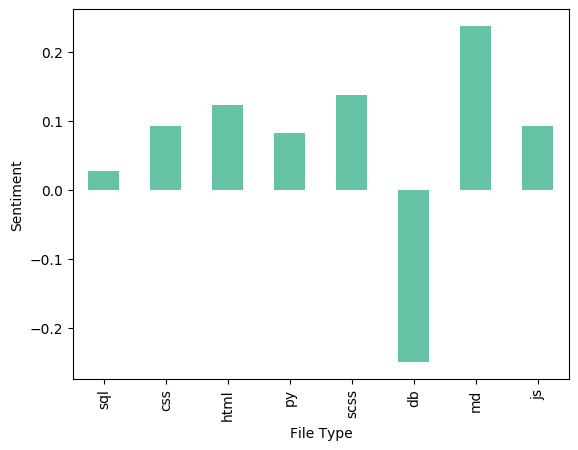
A commit has a list of changes to files as well as the number of lines added or removed from these files. By looking at commits that altered language specific files, I was able to deduce that people really did not like handling database migrations. During my presentation the exaggerated groans at the mere mention of "Alembic" confirmed this!
Positivity Rankings
At the end of Hackday, we have the option of giving presentations on our hacks. I gave a shout out to the top five commit authors who used, on average, the most emotionally positive language. The full ranking graph has been censored and is displayed below to show the wide range of polarity.
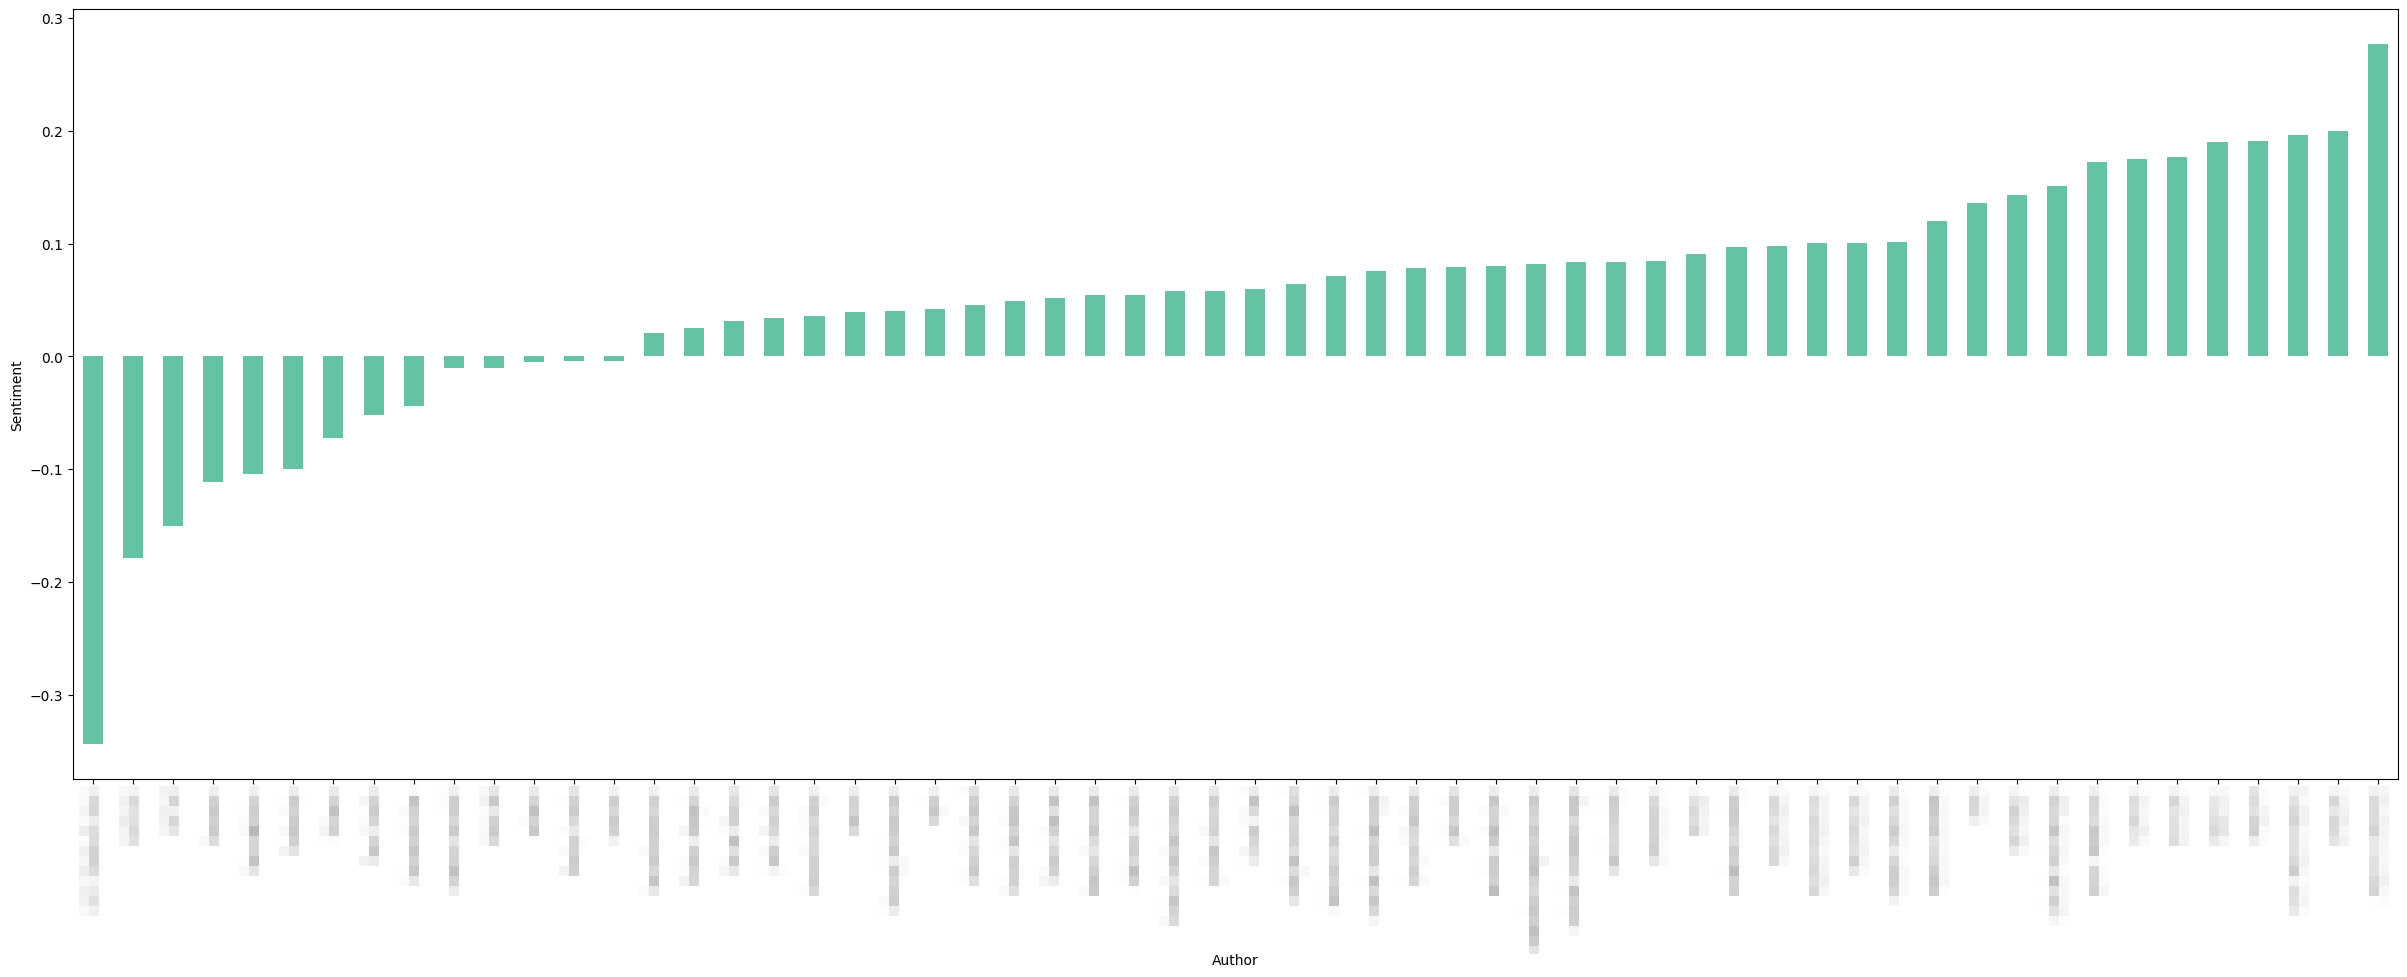
The number of commit comments per author was not taken into account. It’s important to note that a negative score could come from working in an area of the code where the common way to describe changes involves using a keyword that is classified erroneously.
Reflecting
The emotional content of open source projects and their commit comments, issues, pull requests, and READMEs are important in ensuring community participation and the health of our industry.
Hackday was a great opportunity for me to build on my analytical skills and discover libraries and methods that may become relevant in my future work. It’s one of the many initiatives we have that keep developers learning and growing so that we can build a smarter, better product. We’re hiring the kind of people who read engineering blogs for fun https://tails.com/careers/.
[1] Guzman, Emitza & Azócar, David & Li, Yang. (2014). Sentiment analysis of commit comments in GitHub: An empirical study. 11th Working Conference on Mining Software Repositories, MSR 2014 - Proceedings. 10.1145/2597073.2597118.